
Web Application Firewall
The Firewall is an ordered list of rules that run for every request matching a route in the project. Each rule has an expression and an action — block, log, or allow.
The Firewall page#
The Firewall tab lists every zone in the project (one per location), with its status, description, rule count, and a 24-hour match sparkline so you can see how busy each rule has been.
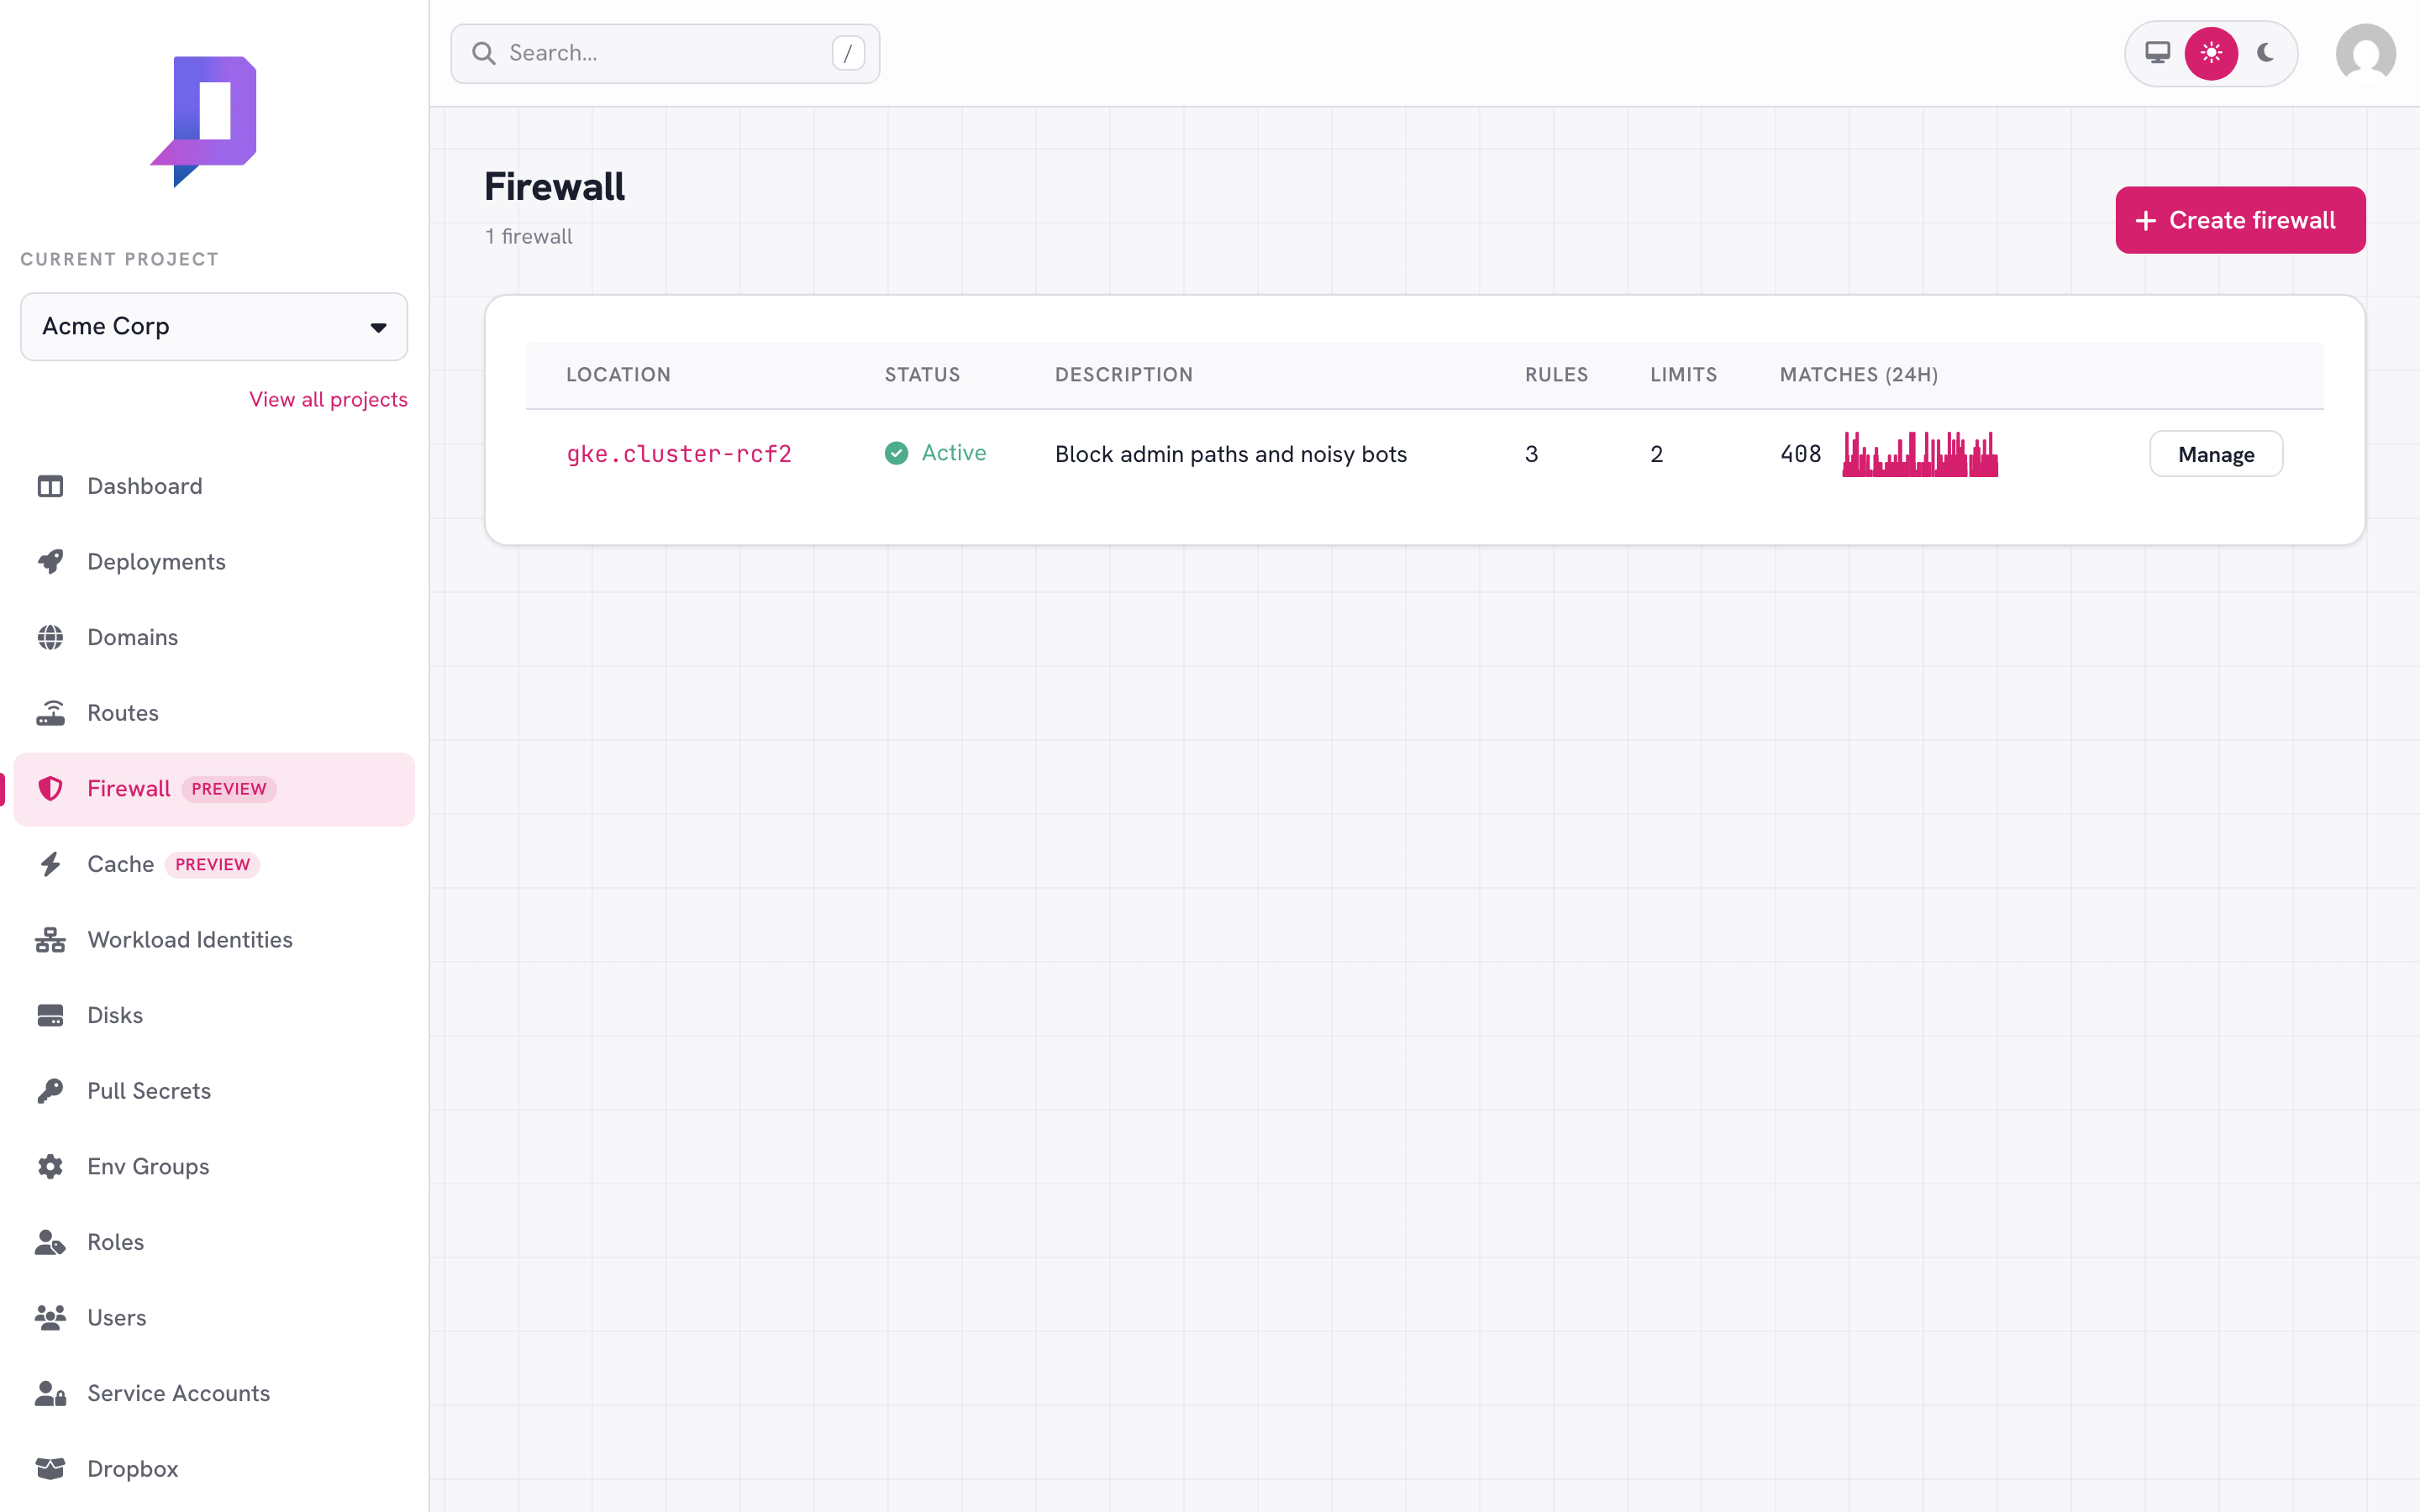
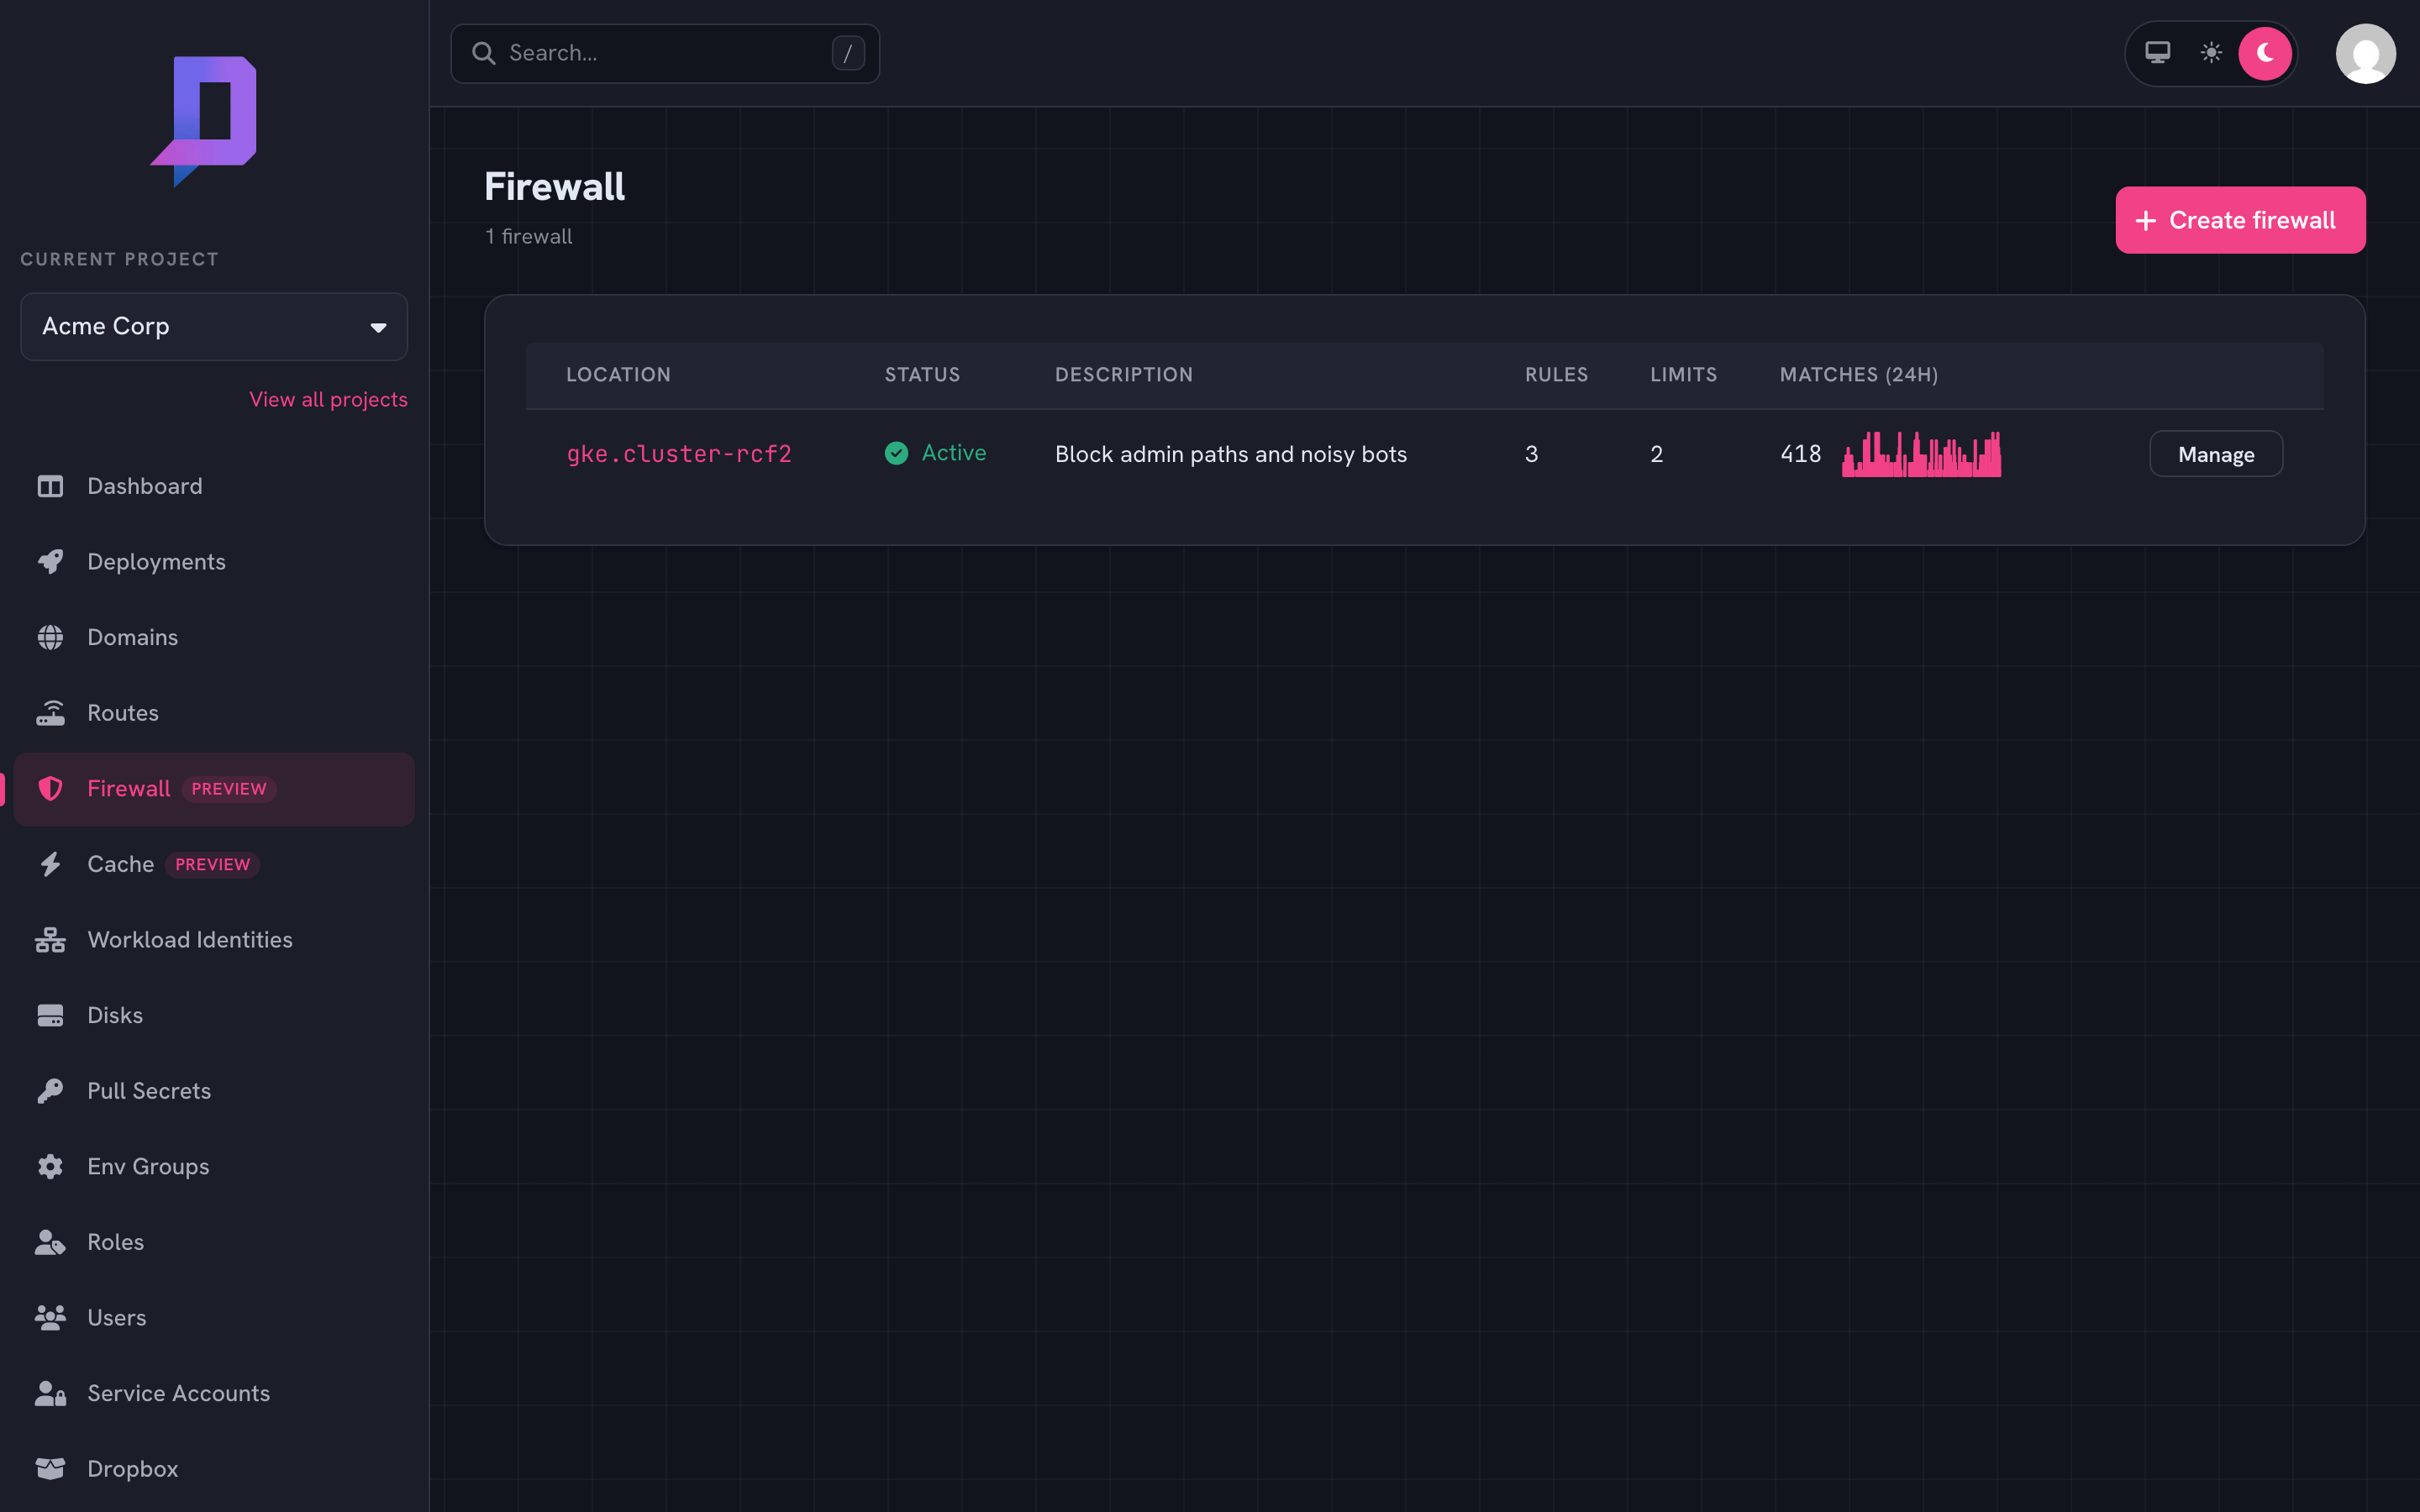
Click Manage to view, edit, and reorder the zone’s rules.
How rules work#
Rules evaluate in priority order — lowest priority number first. The first rule whose expression matches the request decides the outcome:
| Action | Effect |
|---|---|
block | Return the configured status (default 403) and stop. The request never reaches your deployment. |
log | Record a match in metrics and continue evaluating later rules. |
allow | Stop evaluating and forward the request to the deployment, bypassing later rules. |
A request that doesn’t match any rule is forwarded normally.
{
  "id": "block-admin",
  "description": "Block external access to /admin",
  "expression": "request.path.startsWith('/admin')",
  "action": "block",
  "status": 403,
  "message": "Forbidden",
  "priority": 10
}
The expression language#
Rule expressions are small boolean expressions over the request. Common references:
request.path— the URL path (string).request.method—GET,POST, …request.ip— the client IP as seen by the gateway.request.headers['name']— a header value (string), lowercased name.request.host— the request hostname.
Operators: ==, !=, &&, ||, !, plus the string helpers
.startsWith(s), .endsWith(s), and .contains(s).
request.path.startsWith('/admin')
request.headers['user-agent'].contains('bot')
request.ip == '203.0.113.7'
request.path.endsWith('.php') && !request.headers['x-internal'].contains('yes')
Patterns#
Always allow your own egress IPs. Stick an allow rule with low priority
at the top of the zone so good traffic short-circuits the rest of the rules.
priority 10 — allow — request.ip == '203.0.113.7'
priority 50 — block — request.path.startsWith('/admin')
priority 90 — log   — request.headers['user-agent'].contains('bot')
Roll out new blocks safely. Add a rule as log first, watch the matches
on the metrics page for a day, then flip it to block once you’ve confirmed
it’s catching what you expect (and not what you don’t).
Rate limiting#
Alongside the block/log/allow rules, a zone can carry rate limits — counters that reject (or just watch) traffic arriving faster than a threshold. Limits are independent of the rules: they’re evaluated for every request the zone covers, so a request that passes every rule can still be rejected by a limit.
A limit sorts requests into buckets and rejects a bucket once it exceeds
rate requests per window. What defines a bucket is the key:
| Key | One bucket per |
|---|---|
ip | client IP (the default) |
host | request hostname |
asn | client network (autonomous system number) |
country | client country |
header:<name> | value of a request header |
cookie:<name> | value of a cookie |
List several to bucket on the combination — ["ip", "host"] limits each IP
per host. With no key the limit defaults to ["ip"].
Limits live on the same zone as the rules. Set them with waf.set, in a
limits array next to rules — and, like the rules, waf.set replaces the
whole zone, so send the full limits list every time:
"limits": [
  {
    "description": "100 req/min per IP",
    "key": ["ip"],
    "rate": 100,
    "window": "1m"
  },
  {
    "description": "Throttle login to slow credential stuffing",
    "key": ["ip"],
    "rate": 5,
    "window": "1m",
    "filter": "request.path == '/login' && request.method == 'POST'",
    "status": 429,
    "message": "Too many attempts — slow down."
  }
]
Each limit understands:
| Field | Meaning | |
|---|---|---|
rate | required | Max requests per window per bucket (> 0). |
window | required | Go duration, 1s–1h (e.g. 30s, 1m, 1h). |
key | optional | Bucket characteristics (above); default ["ip"]. |
algorithm | optional | fixed (default) fixed window, or sliding for a smoother rolling window. |
mode | optional | enforce (default) rejects; shadow only counts — see below. |
status | optional | Response status when limited: 429 (default) or 503. |
message | optional | Response body when limited (default Too Many Requests). |
filter | optional | A CEL expression (the same request.* surface as rule expressions) scoping the limit to matching requests; empty means every request. A filter that errors at runtime fails open — the limit is skipped — so a bad filter can’t reject good traffic. |
A zone holds up to 20 limits.
Size a limit in shadow mode first. Set "mode": "shadow" and the limit
counts matches without rejecting anything. Watch the limited share on the metrics
page for a day or two, confirm the threshold only catches abuse, then flip it to
enforce. It’s the rate-limit equivalent of rolling out a rule as log before
block.
Metrics#
The Firewall metrics page plots matches per (rule, action) over a selectable window — 1h, 6h, 12h, 1d, 7d, 30d — so you can see which rules are hot and catch rule changes that suddenly start matching production traffic.
The same data is available via the API:
curl https://api.deploys.app/waf.metrics \
  -H "Authorization: Bearer $DEPLOYS_TOKEN" \
  -d '{ "project": "acme", "location": "gke.cluster-rcf2",
        "timeRange": "1d" }'
Rate limits have their own series via waf.limitMetrics, returned per
(limit, result) where result is allowed or limited. Charting the limited
share — limited / (allowed + limited) — is how you size a shadow limit
before enforcing it.
curl https://api.deploys.app/waf.limitMetrics \
  -H "Authorization: Bearer $DEPLOYS_TOKEN" \
  -d '{ "project": "acme", "location": "gke.cluster-rcf2",
        "timeRange": "1d" }'
Firewall events#
Metrics tell you how often a rule fired; events show you what it caught.
The metrics page keeps a table of recent match samples under the charts — each
row is one concrete request a rule matched: the time, the action taken, the
rule, the client IP and its country, and the request method, host, and path. That’s usually enough to go from “this
rule matched 4,000 times” to “it’s blocking POST /wp-login.php from one
network” without any log access.
Filter the table by rule or by action (block, log, allow), and page
back through history with Load more.
Sampling and retention#
Events are samples, not a request log. Each ingress instance keeps at most 10 events per minute per rule — blocked requests are exempt from that per-rule cap, since blocks are what you came to inspect — and at most 60 events per minute per firewall zone, which bounds everything, blocks included. Under a flood you still get enough examples to recognize the pattern (same IP? same path? same country?) without recording every request.
Because events are sampled, never count them — the metrics charts above count every match and remain the source of truth; events are the examples.
Events are kept for 3 days, then deleted.
API and CLI#
The table is served by waf.events — newest first, with optional ruleId
and action filters:
curl https://api.deploys.app/waf.events \
  -H "Authorization: Bearer $DEPLOYS_TOKEN" \
  -d '{ "project": "acme", "location": "gke.cluster-rcf2",
        "action": "block" }'
The result carries up to limit items (default 50, max 200) and a next
cursor; pass it back as before to fetch the next page, until next comes
back empty.
The same data from the CLI:
deploys waf events --project acme --location gke.cluster-rcf2